The figures look at incidents including both thefts of the cars or vehicles themselves, and incidents of thefts from cars.
These officially published figures have revealed the parts of the city which have seen the most complaints of vehicle crime.
Vehicle crime is defined from the National Crime Recording System codes for this type of crime, and includes theft of a vehicle and theft from a vehicle.
Figures published on Sheffield Council’s ‘Local Insights’ information page has gathered the figures together for specific neighbourhoods.
The figures are for the 12 months from March 2023 to February 2024, and show total number of reports of neighbourhood-level incidents of vehicle crime, and the number as a rate per 1,000 residents.
We have ranked the figures by the number of reports per 1,000 residents.
In total, the city has been split into 70 neighbourhoods in the figures.
The figures are based on where the incidents occurred, not where they were reported from.
We have listed the 26 neighbourhoods in the city with the largest number of vehicle crime incidents in the gallery below. The smaller number of incidents per person are at the top, and the area with the largest number is listed last.
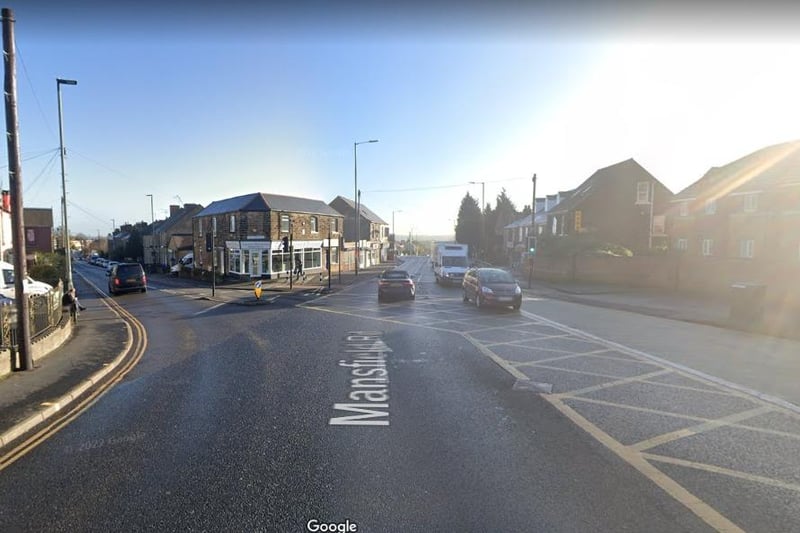
The photos are for illustrative purposes only and figures do not refer to any individual buildings or streets.

1. Worst neighbourhoods for car crime
We have revealed the neighbourhoods which are Sheffield's worst hotspots for car crime | National WorldPhoto: National World

2. 26th: Batemoor & Jordanthorpe
26th: Batemoor & Jordanthorpe had 13.2 neighbourhood-level incidents of vehicle crime per 1,000, residents and a total of 85 overall. Photo: Google | GooglePhoto: Google

3. 25th: Ecclesall & Greystone
25th: Ecclesall & Greystones had 13.3 neighbourhood-level incidents of vehicle crime per 1,000, residents and a total of 120 overall. Photo: Google | GooglePhoto: Google

4. 24th: Intake
24th: Intake had 13.8 neighbourhood-level incidents of vehicle crime per 1,000, residents and a total of 104 overall. Photo: Google | GooglePhoto: Google streetview
